The Case for Bitcoin DCA
The patient warrior is the one that wins the war…
🕒 10 min read
Some time ago I was at a tech/finance convention. While the focus was on finance and security, not investments, I had a fascinating conversation during one of the after parties.
I spoke with one of the speakers, a very knowledgeable person in finance who had made some solid market bets. What began as a discussion on financial transaction systems eventually turned to cryptocurrencies, particularly Bitcoin, and its potential as a transaction layer.
His thesis was straightforward: “Bitcoin is here to stay, and it gives us a glimpse into the future of financial infrastructure.”
This wasn’t a tinfoil-hat conspiracy. He wasn’t talking about Central Bank Digital Currencies or speculative hype. Instead, he believed that blockchain technology would underpin future transactions, and that Bitcoin was a derivative bet on that infrastructure.
Why Dollar Cost Averaging?
He advocated for a simple investment strategy: set a weekly allowance and buy Bitcoin every week. This strategy, known as Dollar Cost Averaging (DCA), smooths out volatility and minimizes risk.
According to him, this approach makes it unlikely you'll end up underwater (i.e., your investment being worth less than what you put in). The risk-to-reward ratio, he said, was very favorable.
Simulating DCA with Python
Let’s take this theory and run a simulation. We’ll write a Python script to simulate weekly investments into Bitcoin using historical data.
We assume a weekly investment of $50 and use historical weekly closing prices stored in a file called btc_price_weekly.csv.
Our simulation tracks the total amount invested, the total Bitcoin accumulated, and the current portfolio value at each step.
Python Simulation Code
def simulate_forward(df, weekly_investment_usd):
    total_rows = len(df)
    results = []

    for run in range(1, total_rows + 1):
        subset = df.iloc[-run:]

        btc_accumulated = 0
        total_invested_usd = 0

        for _, row in subset.iterrows():
            btc_accumulated += weekly_investment_usd / row['close']
            total_invested_usd += weekly_investment_usd

        valuation_price = subset.iloc[0]['close']
        valuation_date = subset.iloc[0]['timeClose']

        portfolio_value = btc_accumulated * valuation_price
        net_gain_loss = portfolio_value - total_invested_usd

        results.append({
            'Date': valuation_date,
            'Total Invested': total_invested_usd,
            'BTC Accumulated': btc_accumulated,
            'Valuation Price': valuation_price,
            'Portfolio Value': portfolio_value,
            'Net Gain/Loss': net_gain_loss
        })

    results_df = pd.DataFrame(results)
    results_df['Date'] = pd.to_datetime(results_df['Date'])
    results_df = results_df.sort_values('Date')

    plt.figure(figsize=(12, 6))
    plt.plot(results_df['Date'], results_df['Portfolio Value'], label='Forward: Portfolio Value', linewidth=2)
    plt.plot(results_df['Date'], results_df['Total Invested'], label='Forward: Total Invested', linestyle='--')
    plt.plot(results_df['Date'], results_df['Net Gain/Loss'], label='Forward: Net Gain/Loss', linestyle=':')
    plt.xlabel('Date')
    plt.ylabel('USD')
    plt.title(f'BTC DCA Simulation – Forward (${weekly_investment_usd}/week)')
    plt.legend()
    plt.grid(True)
    plt.tight_layout()
    plt.show()
Observing the Results
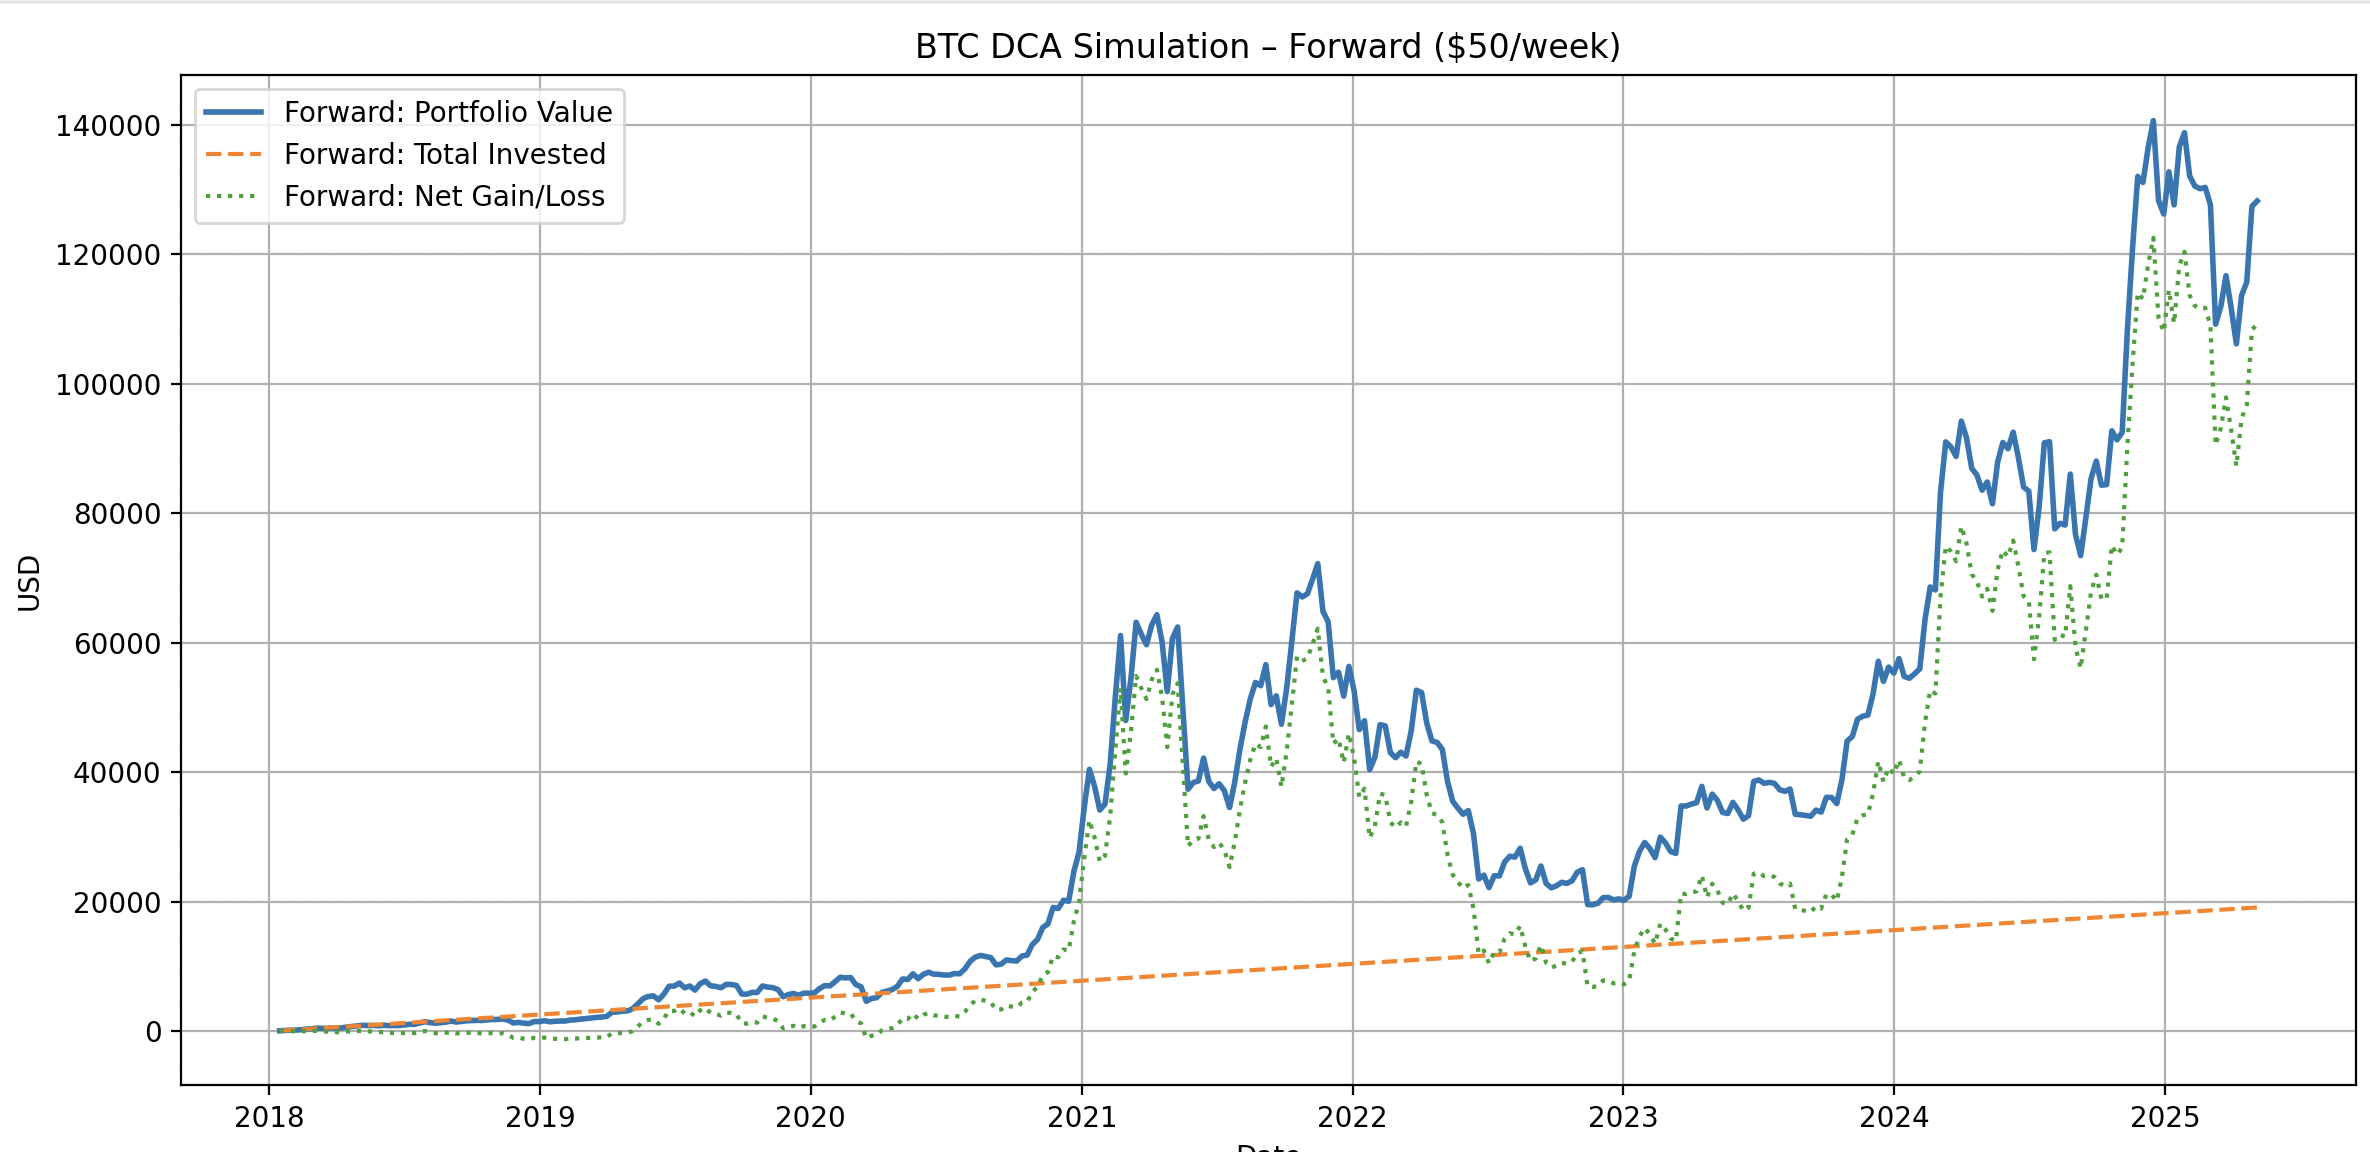
Looking at the simulation results and the chart, we can make some interesting observations:
There have been a few brief periods where the portfolio value dropped below the total invested amount, specifically, from late 2018 to mid-2019, and again in early 2020.
These drawdowns are clearly visible on the chart when the “Total Invested” (Orange) line crosses above the “Portfolio Value” (Blue) line.
However, aside from those short-term dips, the DCA strategy has consistently resulted in a portfolio that is worth more than the total invested capital.
This simulation is based on hindsight, which is always 20/20. What if we didn’t buy early and missed the big price spikes of 2020 and 2021?
Let’s flip the script.
Instead of starting in the past and accumulating forward, we simulate starting at the latest entry and go backward in time, investing $50 per week using historical weekly close prices.
This mimics the experience of someone entering the market recently, wondering:
“What if I had started a few weeks ago, would Bitcoin DCA still make sense for me?”The code for the reverse accumulation is very similar to the original, but simulates going back in time. Lets see what the chart says
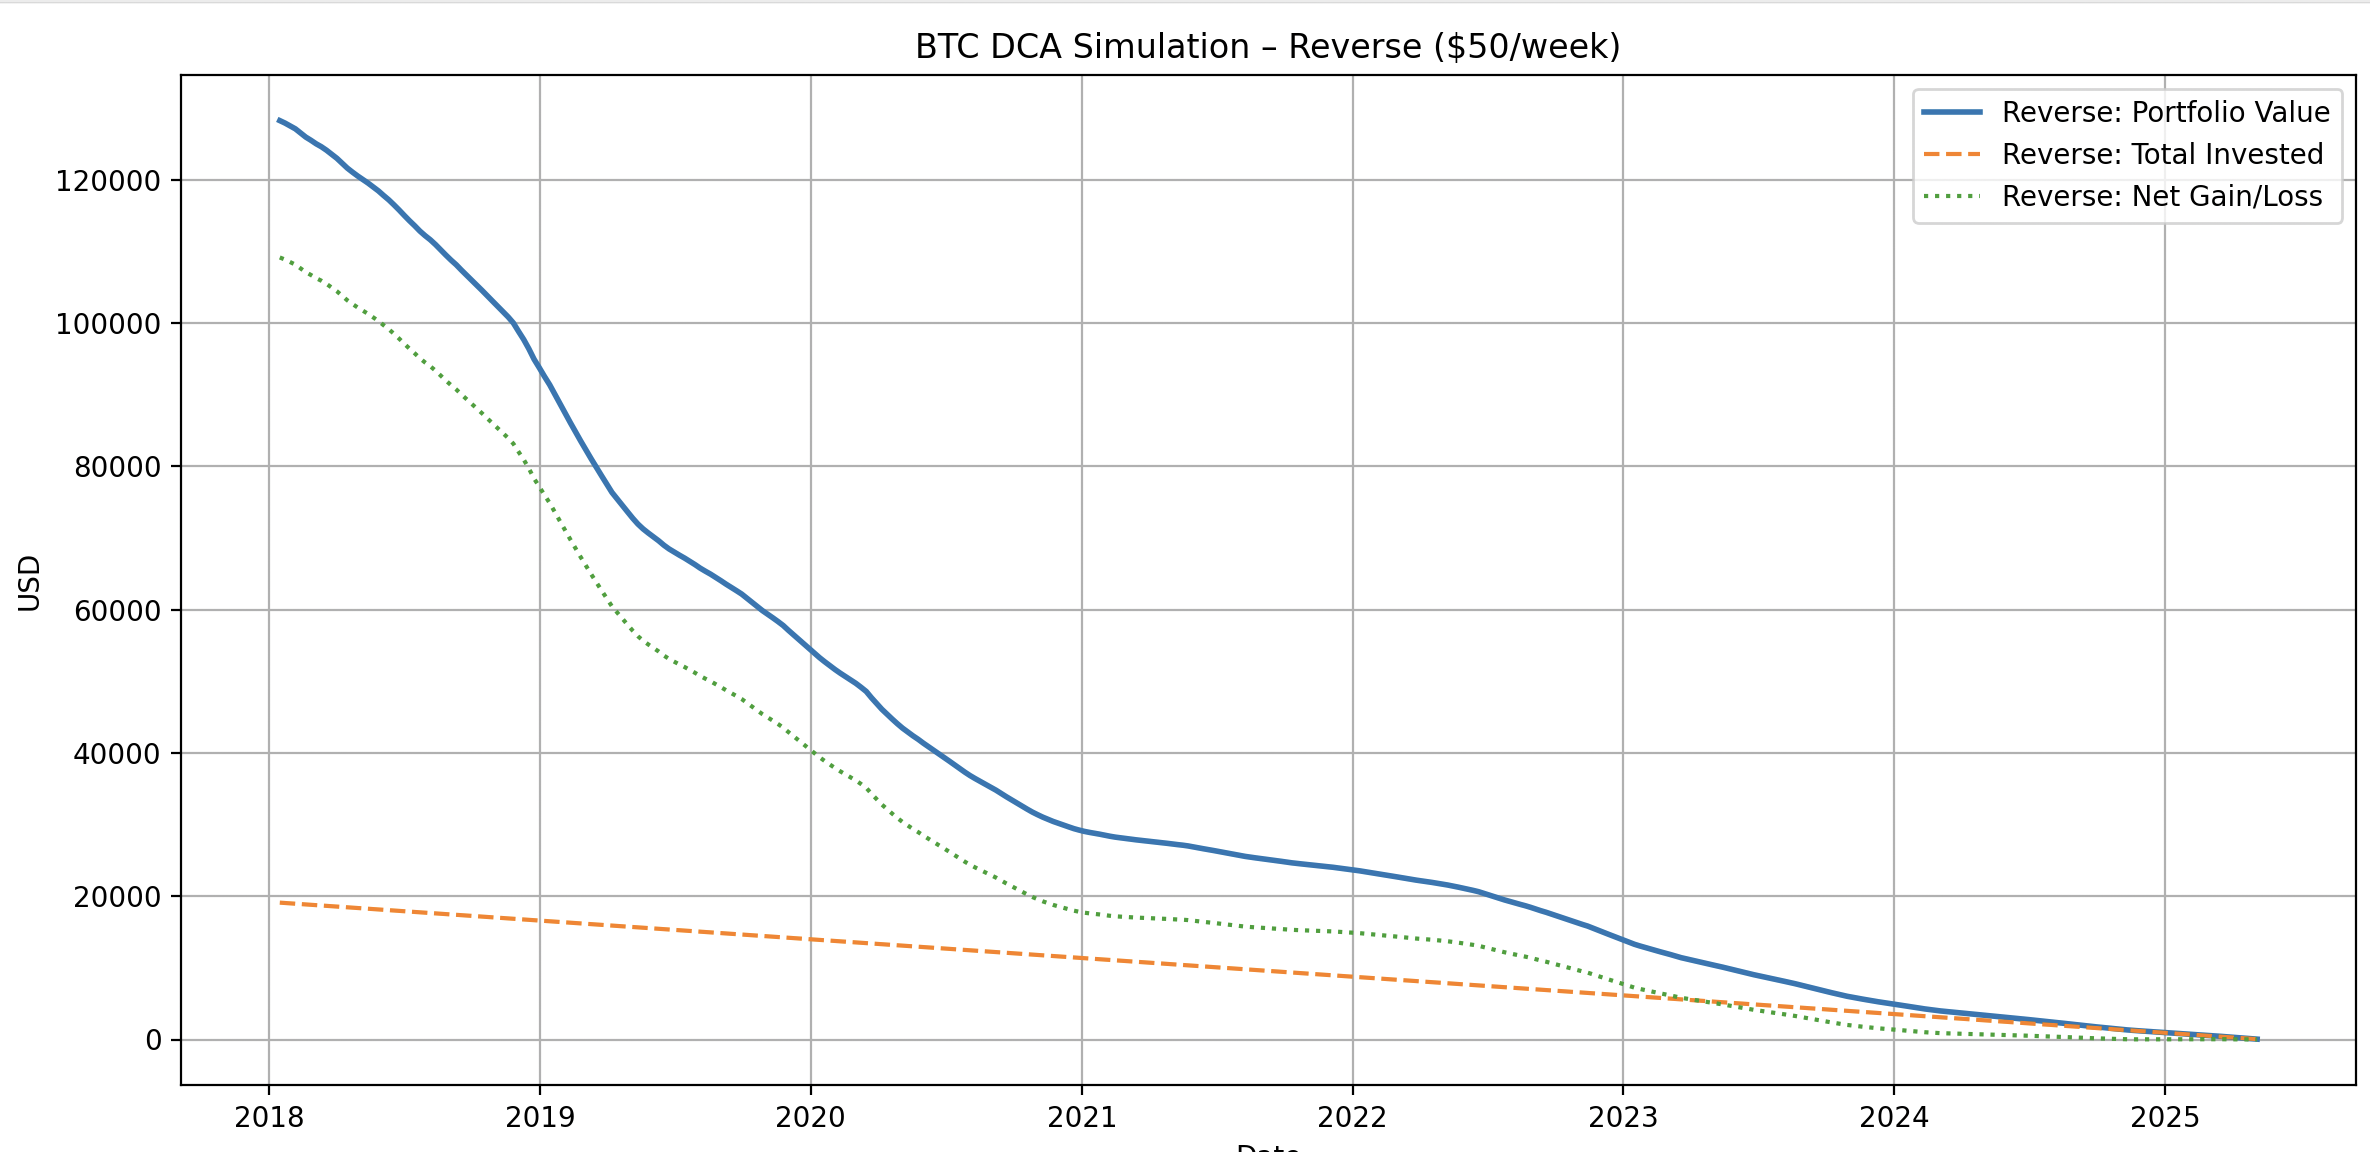
The chart illustrates an important insight:
The later you start accumulating Bitcoin, the lower your portfolio performance, especially in shorter time frames.
If you began DCAing after mid-2024, there's a good chance your portfolio is either underwater or sitting at break-even. This highlights a key principle:
DCA is not about short-term gains. It's a long-term approach to market exposure. Starting during peaks or sideways trends can feel discouraging early on, but DCA helps smooth those bumps over time.
Timing still matters, just not as much as consistency.
Conclusion
The strategy of Dollar Cost Averaging into Bitcoin provides a disciplined, risk-managed way of gaining exposure to a technology that may underpin future finance. Whether or not you believe in Bitcoin’s long-term value, the method of small, consistent investments helps remove emotion from the equation.
The script with all data can be found on this GitHub repository.
It works until it doesn’t...
Until next time..
- Bardur